
EVOLUTION OF THE BROILER SECTOR IN SPAIN
Detailed analysis of:
The Broiler Sector in figures
(Directorate General for Agricultural Production and Markets, August 2024)
Introduction
This report details the evolution of the sector through a comprehensive analysis based on the annual reports of the Ministry of Agriculture, Fisheries and Food (MAPA).
In the summary prepared by NeXusAvicultura, we address what we have considered the fundamental aspects of the broiler sector in Spain in terms of production, prices, foreign trade, consumption, etc., at national and regional level.
In all cases we confine ourselves to reproducing what is set out in the aforementioned MAPA report, with the interpretation we make, under our own responsibility, of the data presented, and its comparison with previous years, for which its accuracy is solely the responsibility of that body.
However, we would note beforehand that the only data we have not included are the figures on the number of farms by poultry species, as we find it incredible that figures are given for, for example, a thousand duck farms, nearly 3,000 pigeon farms, 321 (!!) ratite (ostrich) farms, etc. These are figures that have been carried over from previous years and which, consequently, can only be attributed to the failure to verify that a farm is still active when compiling these censuses.
Economic importance of the sector
The value of total poultry meat production has been growing slightly in recent years, as shown in the following data:
| Year | 2010 | 2015 | 2020 | 2023 |
|---|---|---|---|---|
| Final production value of poultry meat | 1,909 | 2,289 | 2,536 | 3,228 |
| Final livestock production value | 13,797 | 16,727 | 19,732 | 27,658 |
| % value relative to final livestock production | 13.8 | 13.6 | 12.6 | 11.7 |
This last point leads us to question the triumphalism that might be inferred from a simple examination of production value, since while it cannot be denied that this has grown, and considerably, so too have other livestock production sectors.
Another observation we consider worth noting at the outset is that, while when we speak of “poultry meat” we almost always think of broiler chicken, we cannot overlook turkey meat, which various reports indicate has been growing steadily for years. In the MAPA report under review, only in one passage is it stated that the production of other poultry meats (including turkey) accounts for 18% of the total, with broiler accounting for 82% of it.
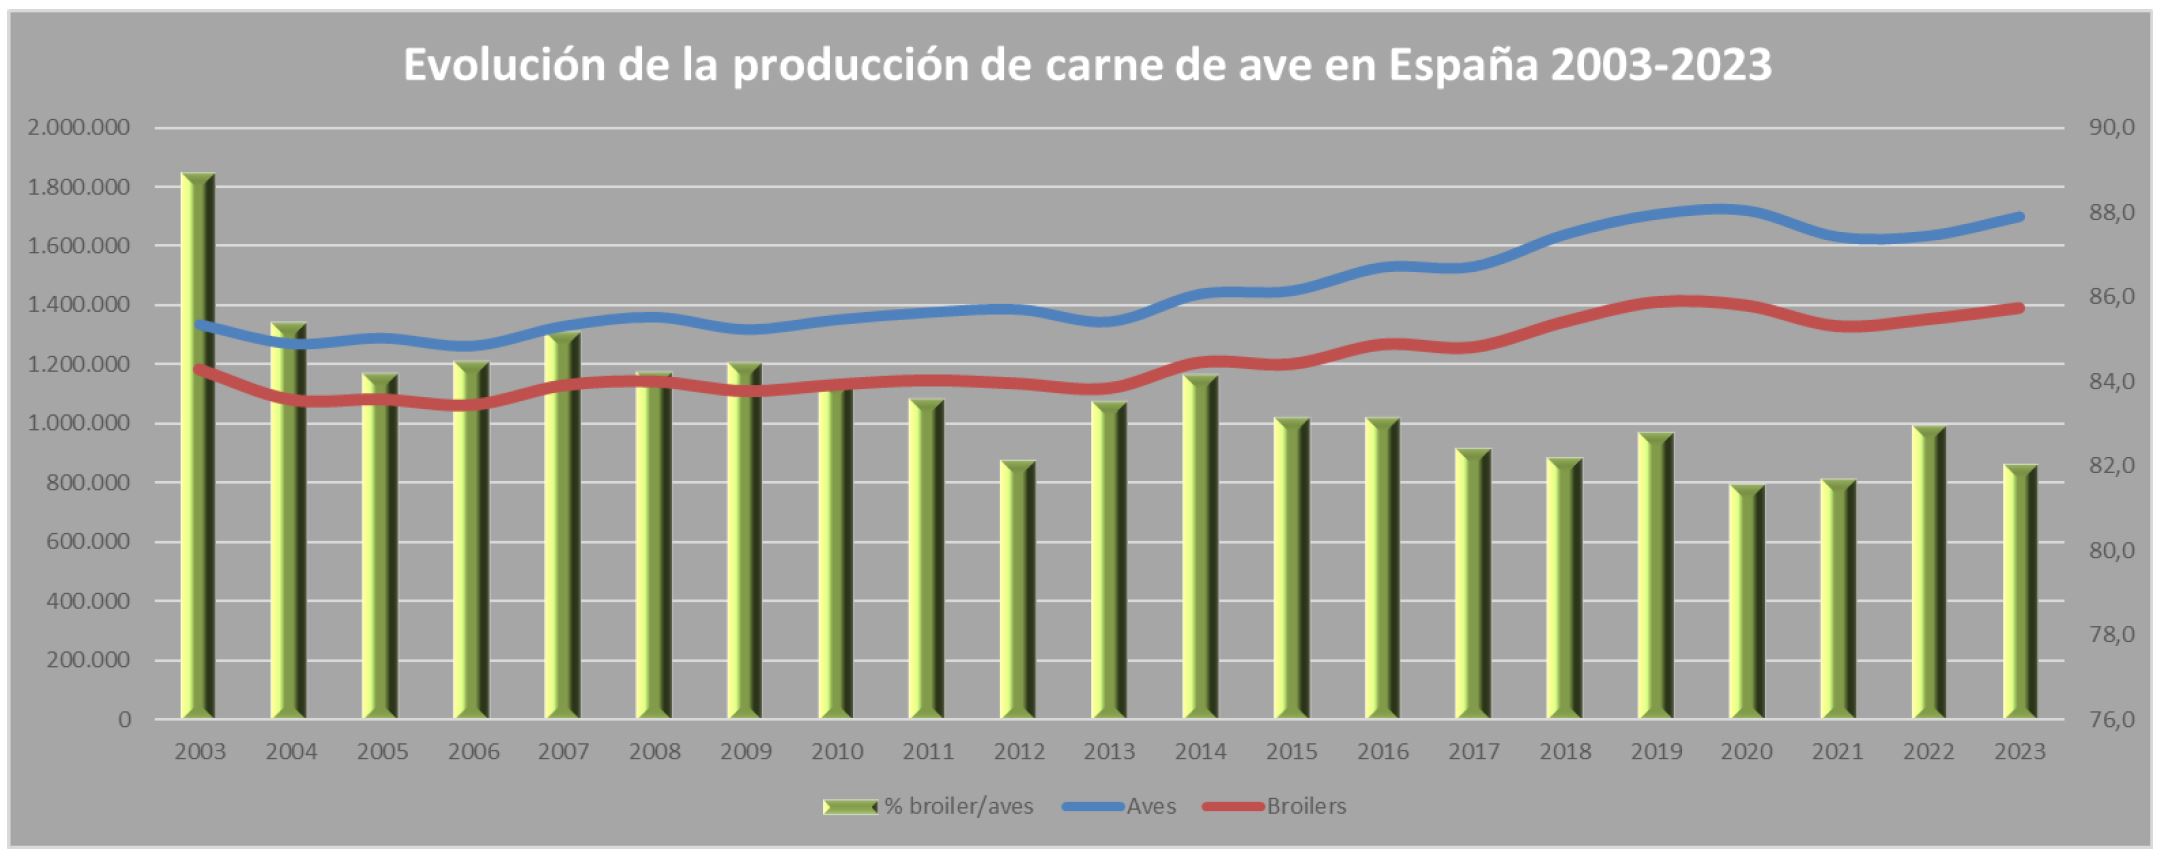
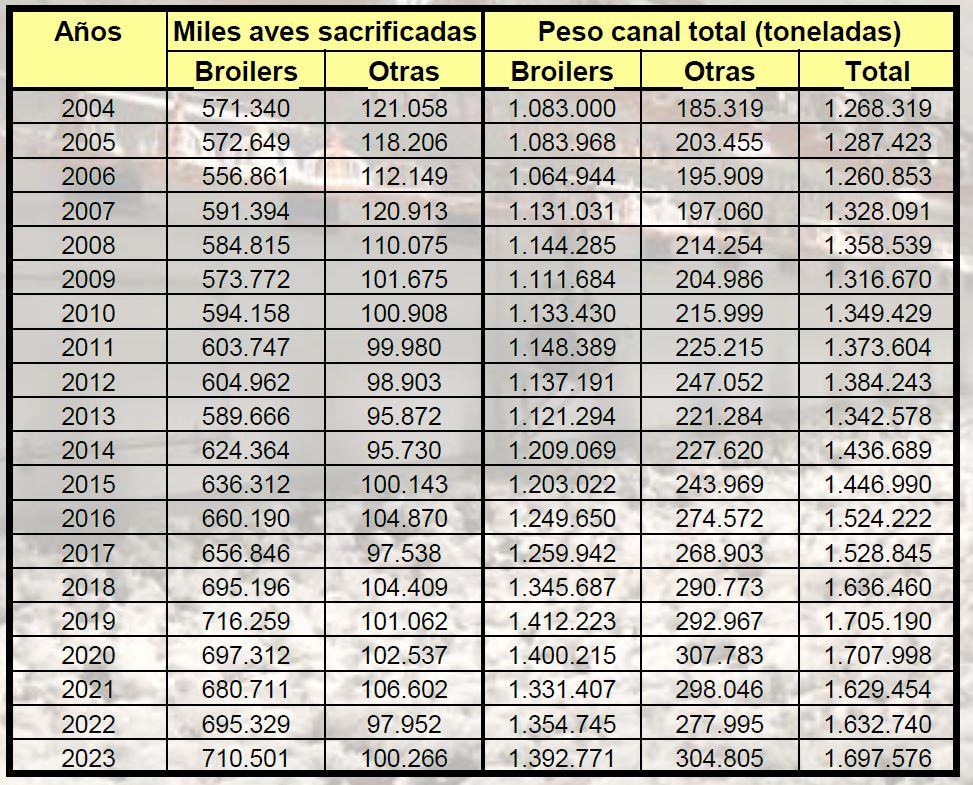
Total poultry meat production
Poultry meat production in Spain has shown a degree of recovery following the decline experienced in 2021 compared with the preceding year. Improvements are evident both in total volume produced and in the number of birds slaughtered, consolidating Spain’s position as a significant player within the European Union.
| Year | Production, t | Birds slaughtered, thousands |
|---|---|---|
| 2021 | 1,629,454 | 787,313 |
| 2022 | 1,632,740 | 793,281 |
| 2023 | 1,697,575 | 810,767 |
One figure that can be derived from these numbers is the average carcass weight of birds slaughtered in Spain in these years: 2.09 kg carcass weight in 2023, only slightly higher than in previous years — a fairly credible figure when we take into account that it includes turkey.
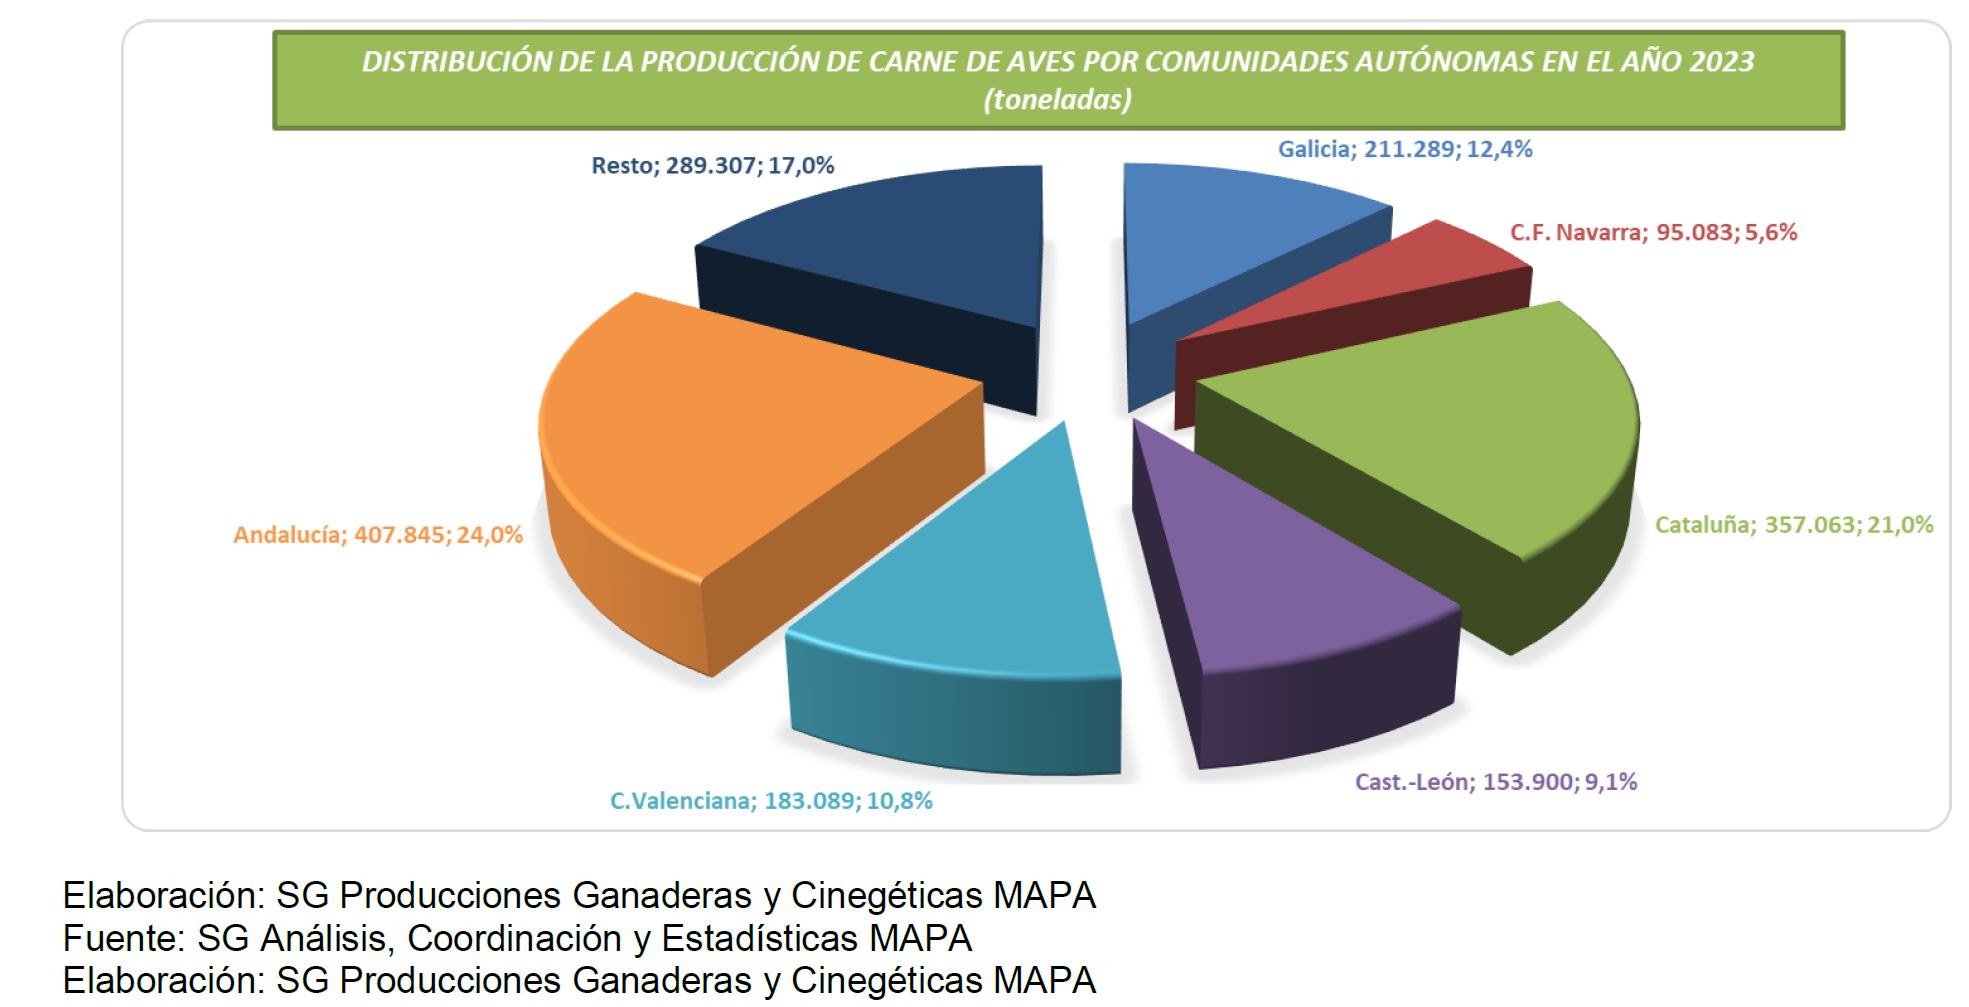
By Autonomous Community, the figures for the main regions are shown in the following table:
| Rank | Autonomous Community | Production, t |
|---|---|---|
| 1st | Andalucía | 407,845 |
| 2nd | Cataluña | 357,063 |
| 3rd | Galicia | 211,289 |
| 4th | Com. Valenciana | 183,089 |
| 5th | Castilla y León | 153,900 |
Regional analysis In 2023, Andalucía, Cataluña and Galicia accounted for just over 57% of national production.
In proportional terms, compared with 2010, the Autonomous Communities that have shown the greatest growth in production are Castilla y León (69%) and Andalucía (52%).
Conversely, the Autonomous Communities for which no data appears are Asturias, the Balearic Islands and the Basque Country, while the one with the lowest production is Aragón, recording only 1,412 tonnes in the most recent year.
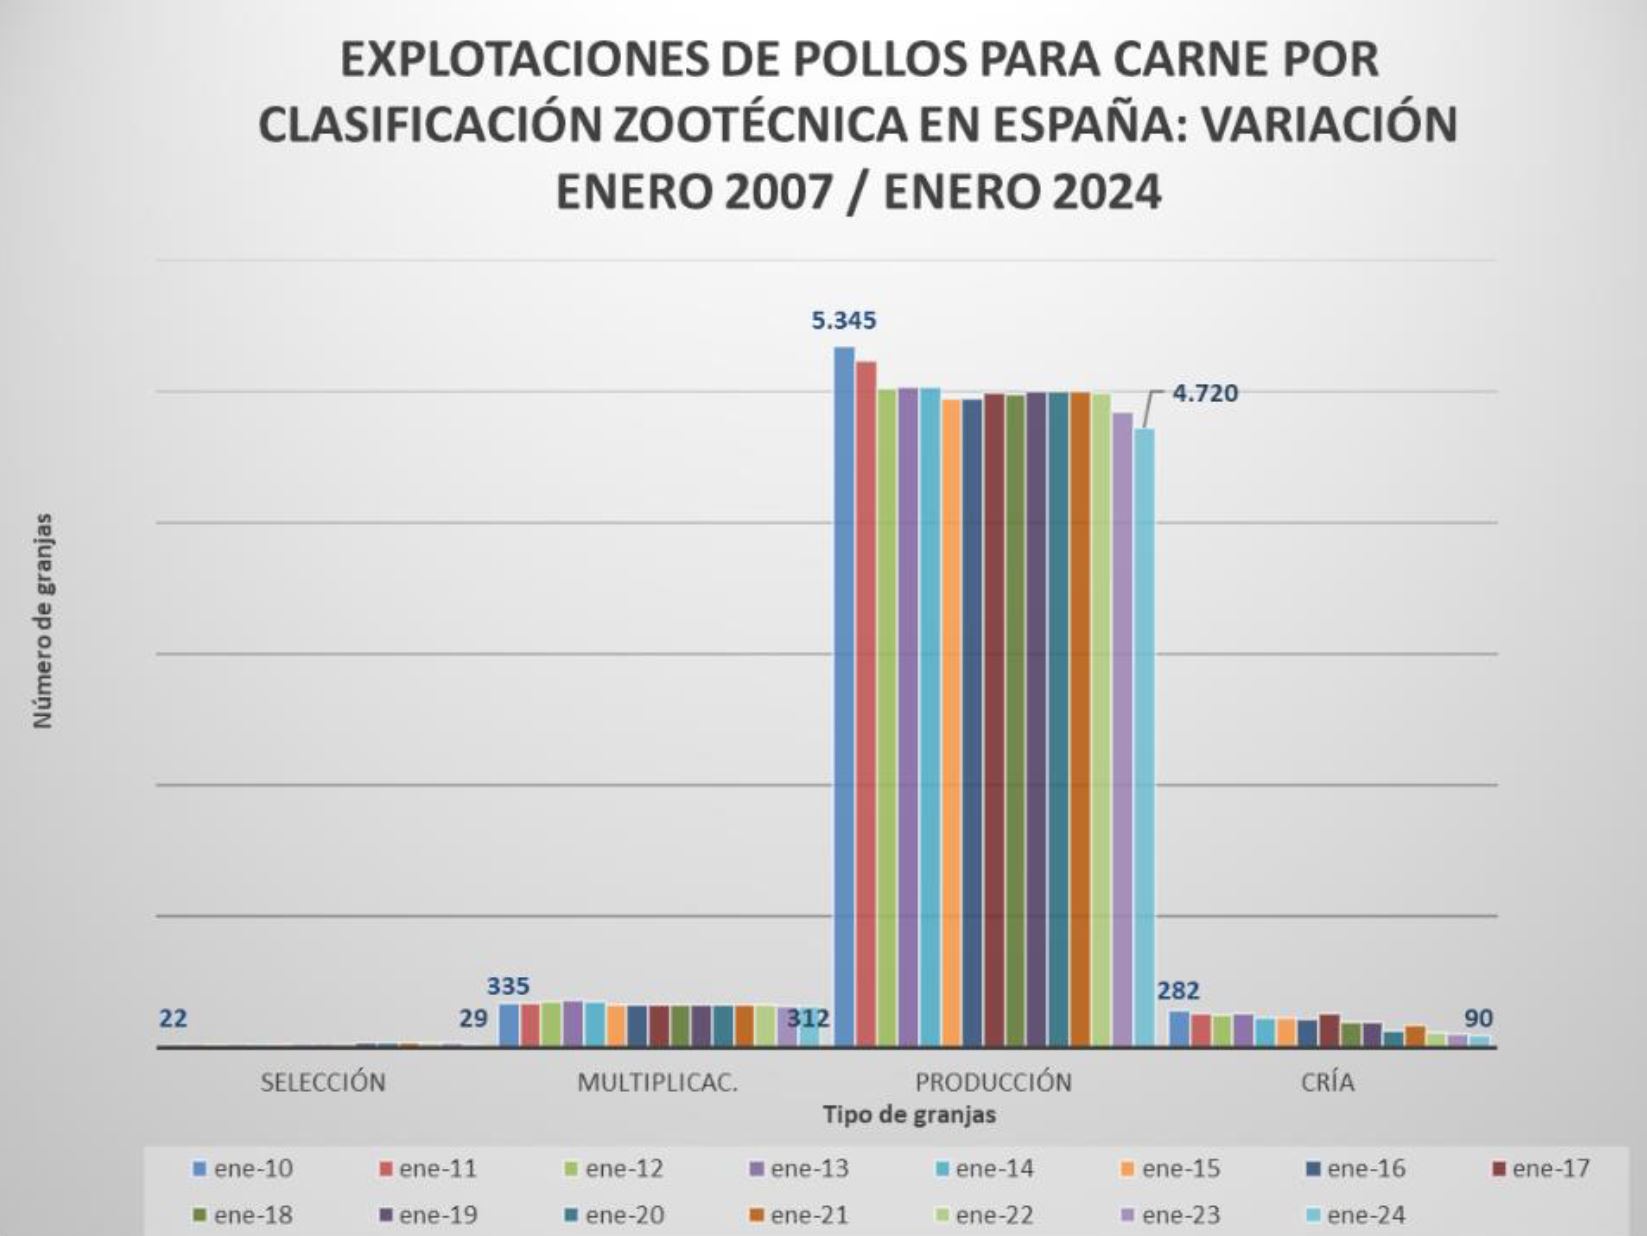
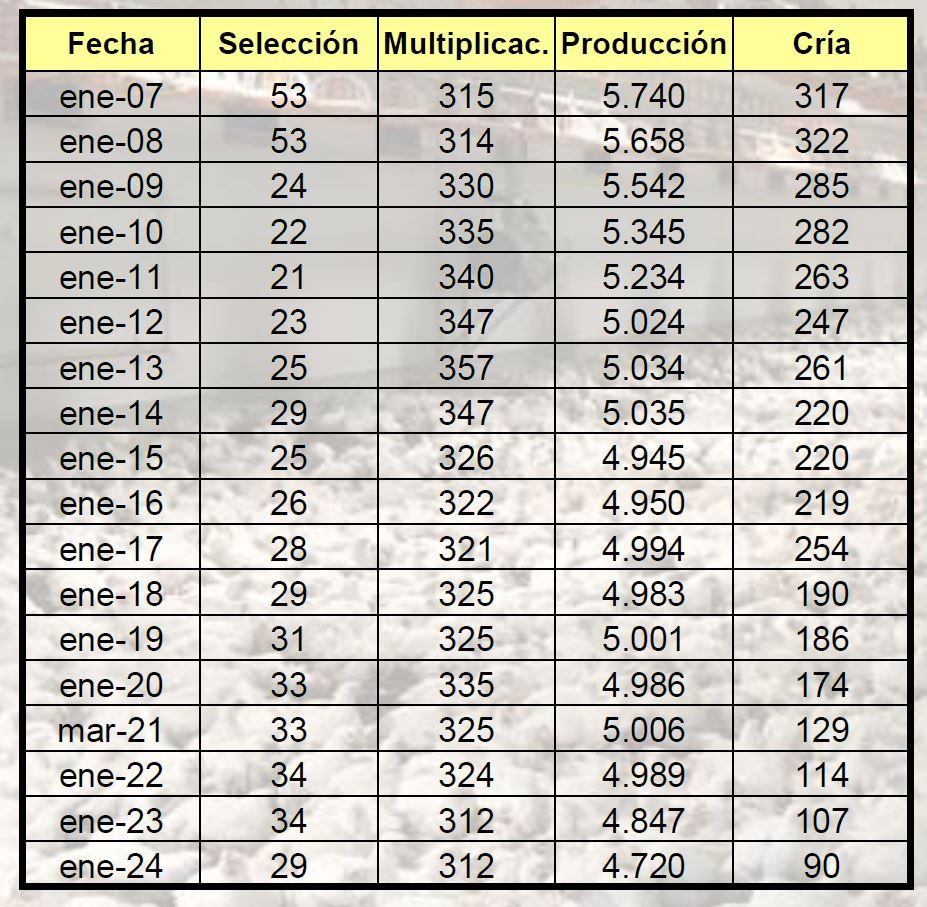
Number of holdings
The following table shows the evolution of broiler production farms over the past few decades.
| Year | No. of farms (*) |
|---|---|
| 2007 | 7,740 |
| 2010 | 5,345 |
| 2015 | 4,945 |
| 2020 | 4,986 |
| 2023 | 4,720 |
(*) As of January
The trend is clear: the number of holdings registered in January 2023 was 17.8% lower than in 2007.
A separate matter would be farm size, which has been increasing considerably in recent years, although we do not have statistical information on this.
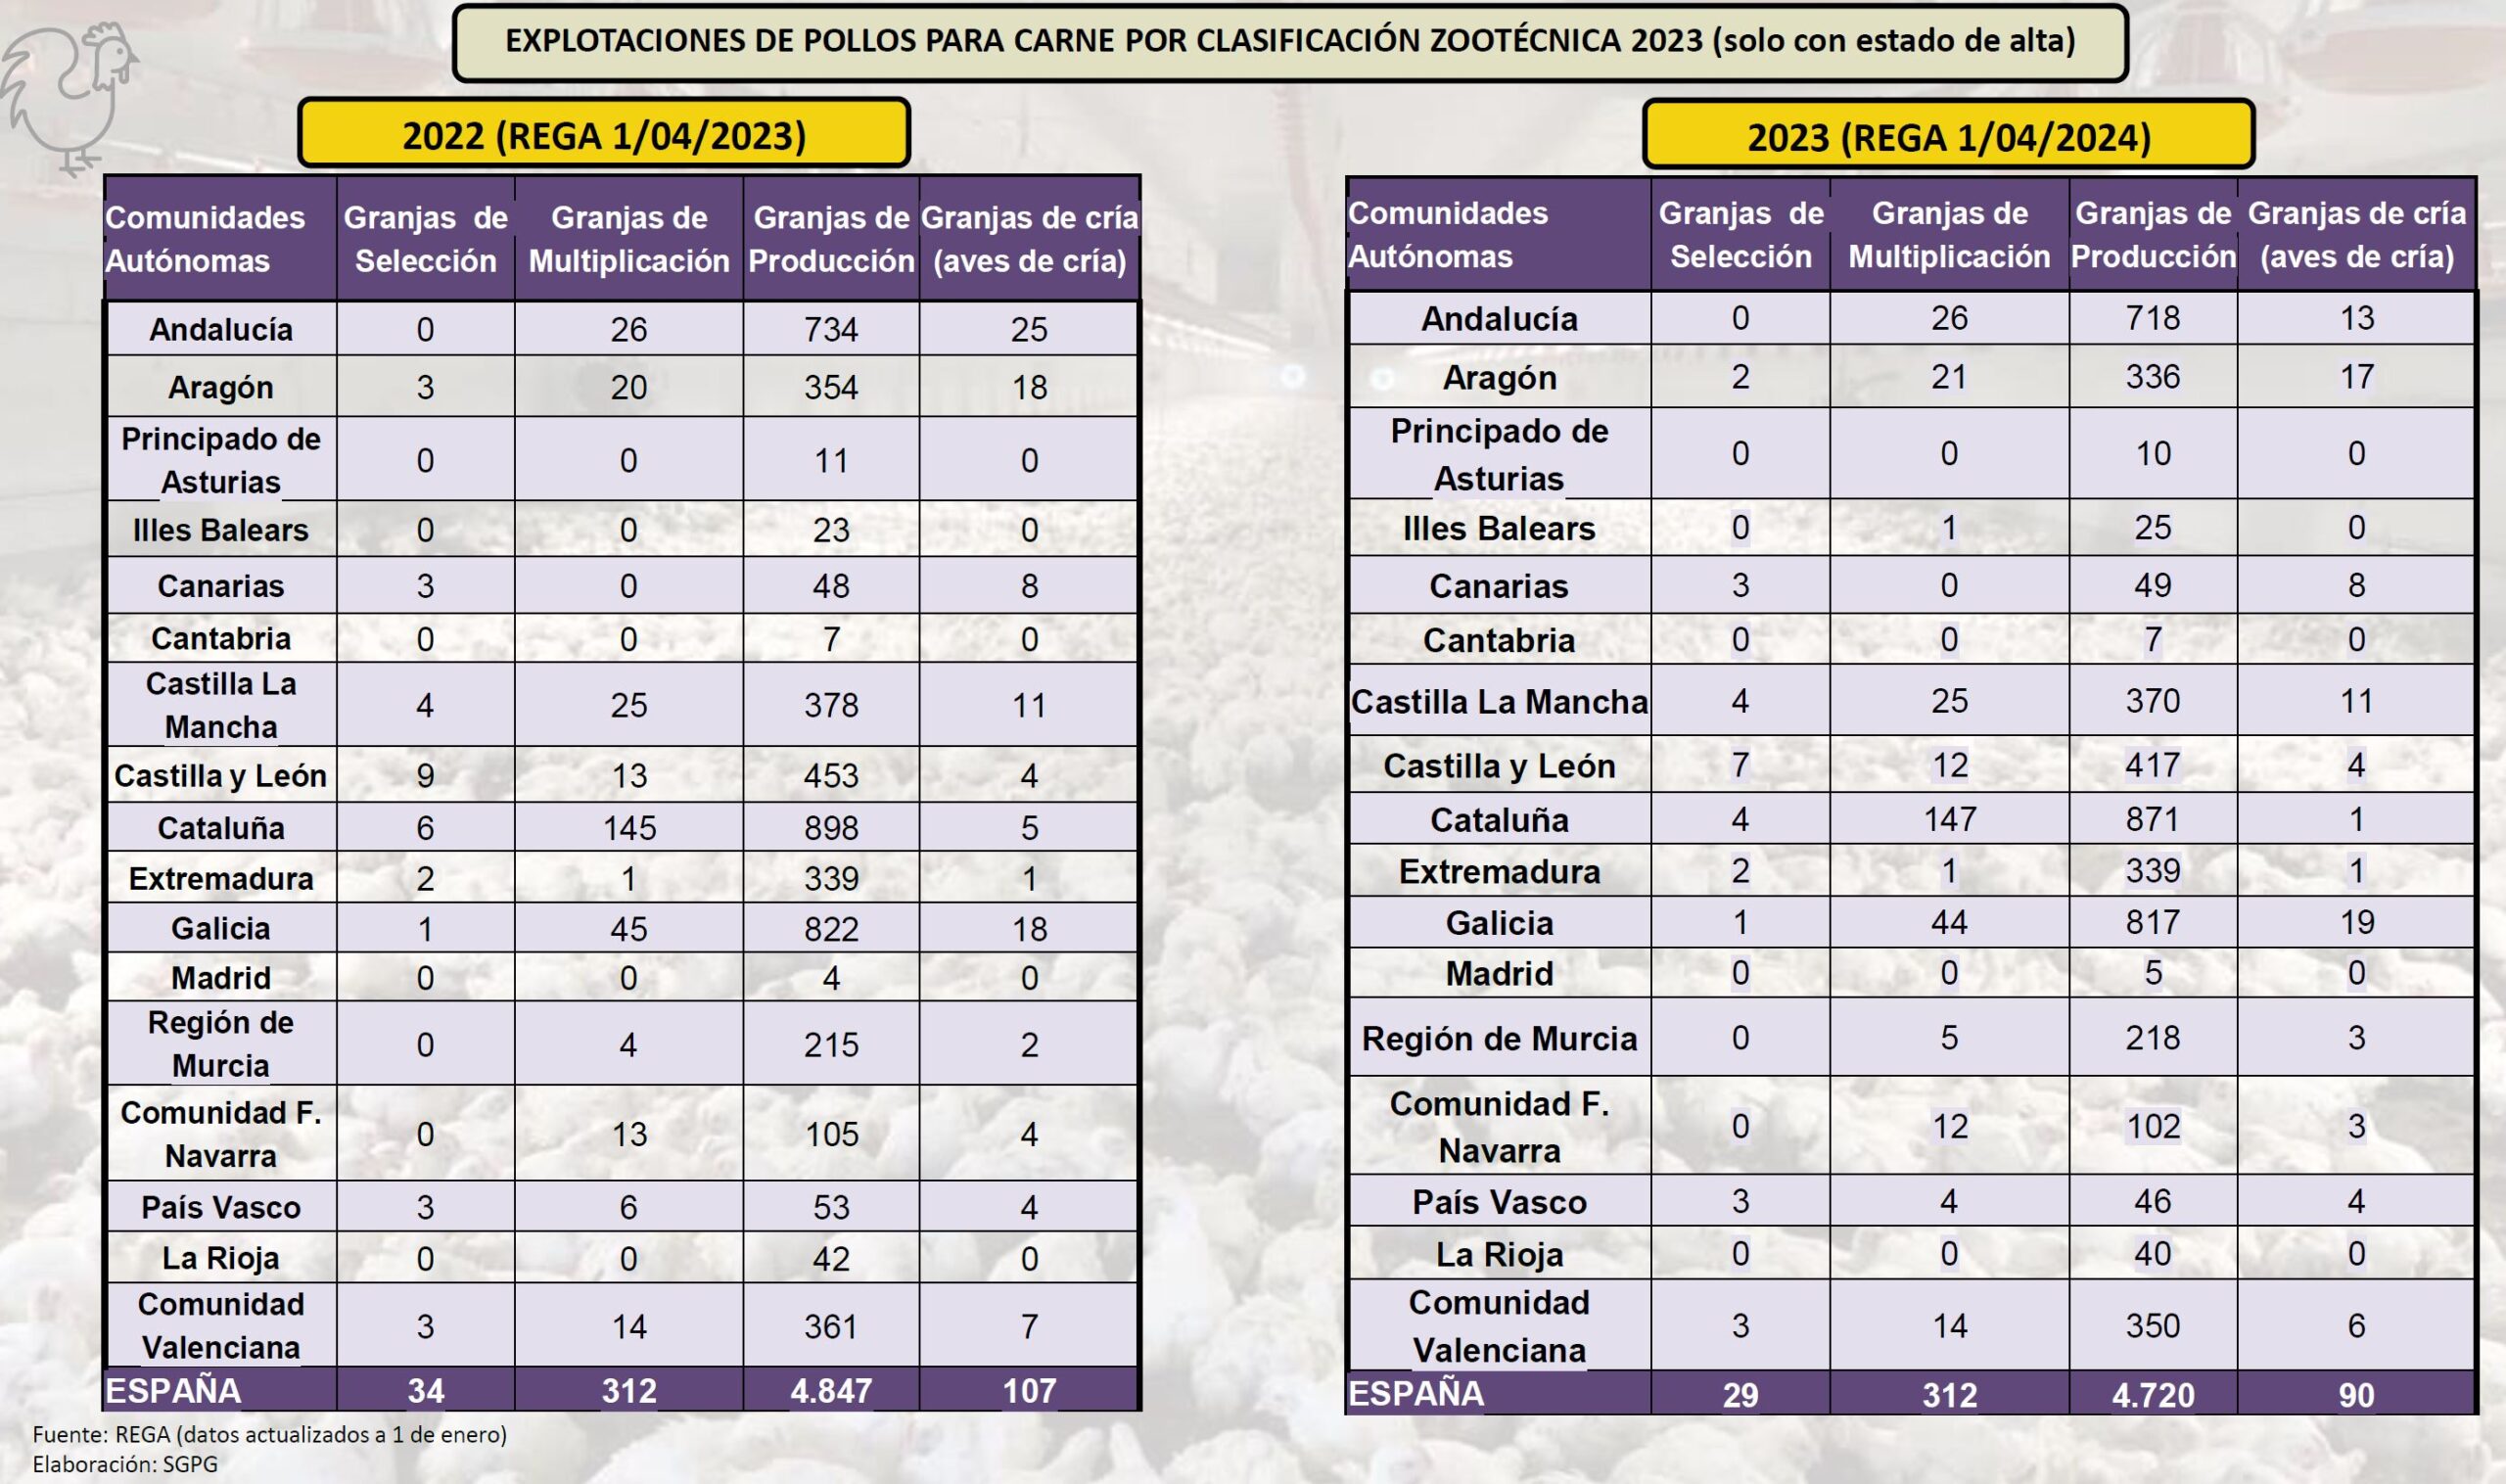
The data presented refer to broiler production farms, independently of breeder farms. For the latter, MAPA indicates that those registered in January of this year numbered 312, the same figure as a year earlier, but significantly fewer than in the previous decade, which ranged between approximately 320 and 330.
Turkey meat
The evolution of turkey meat production is shown in the following table.
| Countries | 2010 | 2015 | 2020 | 2023 |
|---|---|---|---|---|
| Germany | 478 | 458 | 478 | 418 |
| Spain | 159 | 171 | 226 | 229 |
| France | 393 | 340 | 321 | 240 |
| Italy | 298 | 313 | 313 | 211 |
| Hungary | 85 | 77 | 81 | 56 |
| Poland | 205 | 306 | 407 | 367 |
| United Kingdom | 162 | 175 | – | – |
| Rest of EU | 82 | 79 | 92 | 93 |
| EU Total | 1,716 | 1,834 | 2,066 | 1,791 |
The observation here, with regard to Spanish production, is self-evident: a notable increase of 44% in output, at a time when other major producing countries have reduced theirs.
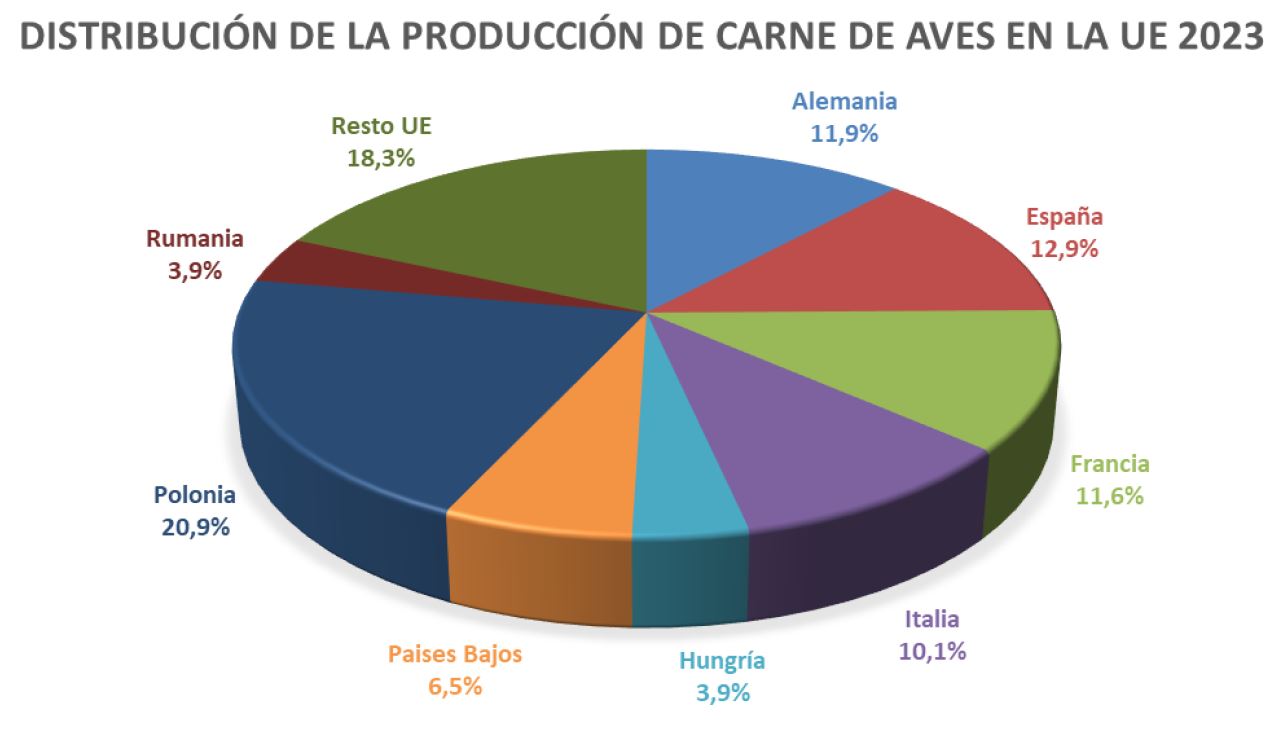
Spanish production in relation to other countries
The following table shows the evolution of the poultry meat sector in relation to the leading producing countries within the European Union.
| Countries | 2010 | 2015 | 2020 | 2023 | % of total |
|---|---|---|---|---|---|
| Poland | 1,342 | 2,011 | 2,696 | 2,746 | 21.3 |
| Spain | 1,349 | 1,447 | 1,707 | 1,698 | 12.8 |
| Germany | 1,380 | 1,511 | 1,613 | 1,565 | 12.0 |
| France | 1,712 | 1,719 | 1,676 | 1,533 | 11.7 |
| Italy | 1,180 | 1,295 | 1,390 | 1,334 | 9.4 |
| Rest (*) | 3,614 | 5,547 | 4,511 | 4,376 | 32.8 |
(*) Note changes in the number of EU member states over the period
Throughout the period shown, Spain’s percentage contribution relative to the EU total has barely changed, even taking into account the shifts caused by the accession and departure of other members.
Of particular note is the growing role of Poland in this field: its poultry meat production in 2010 represented only 12.7% of the EU total and now accounts for 21.3%.
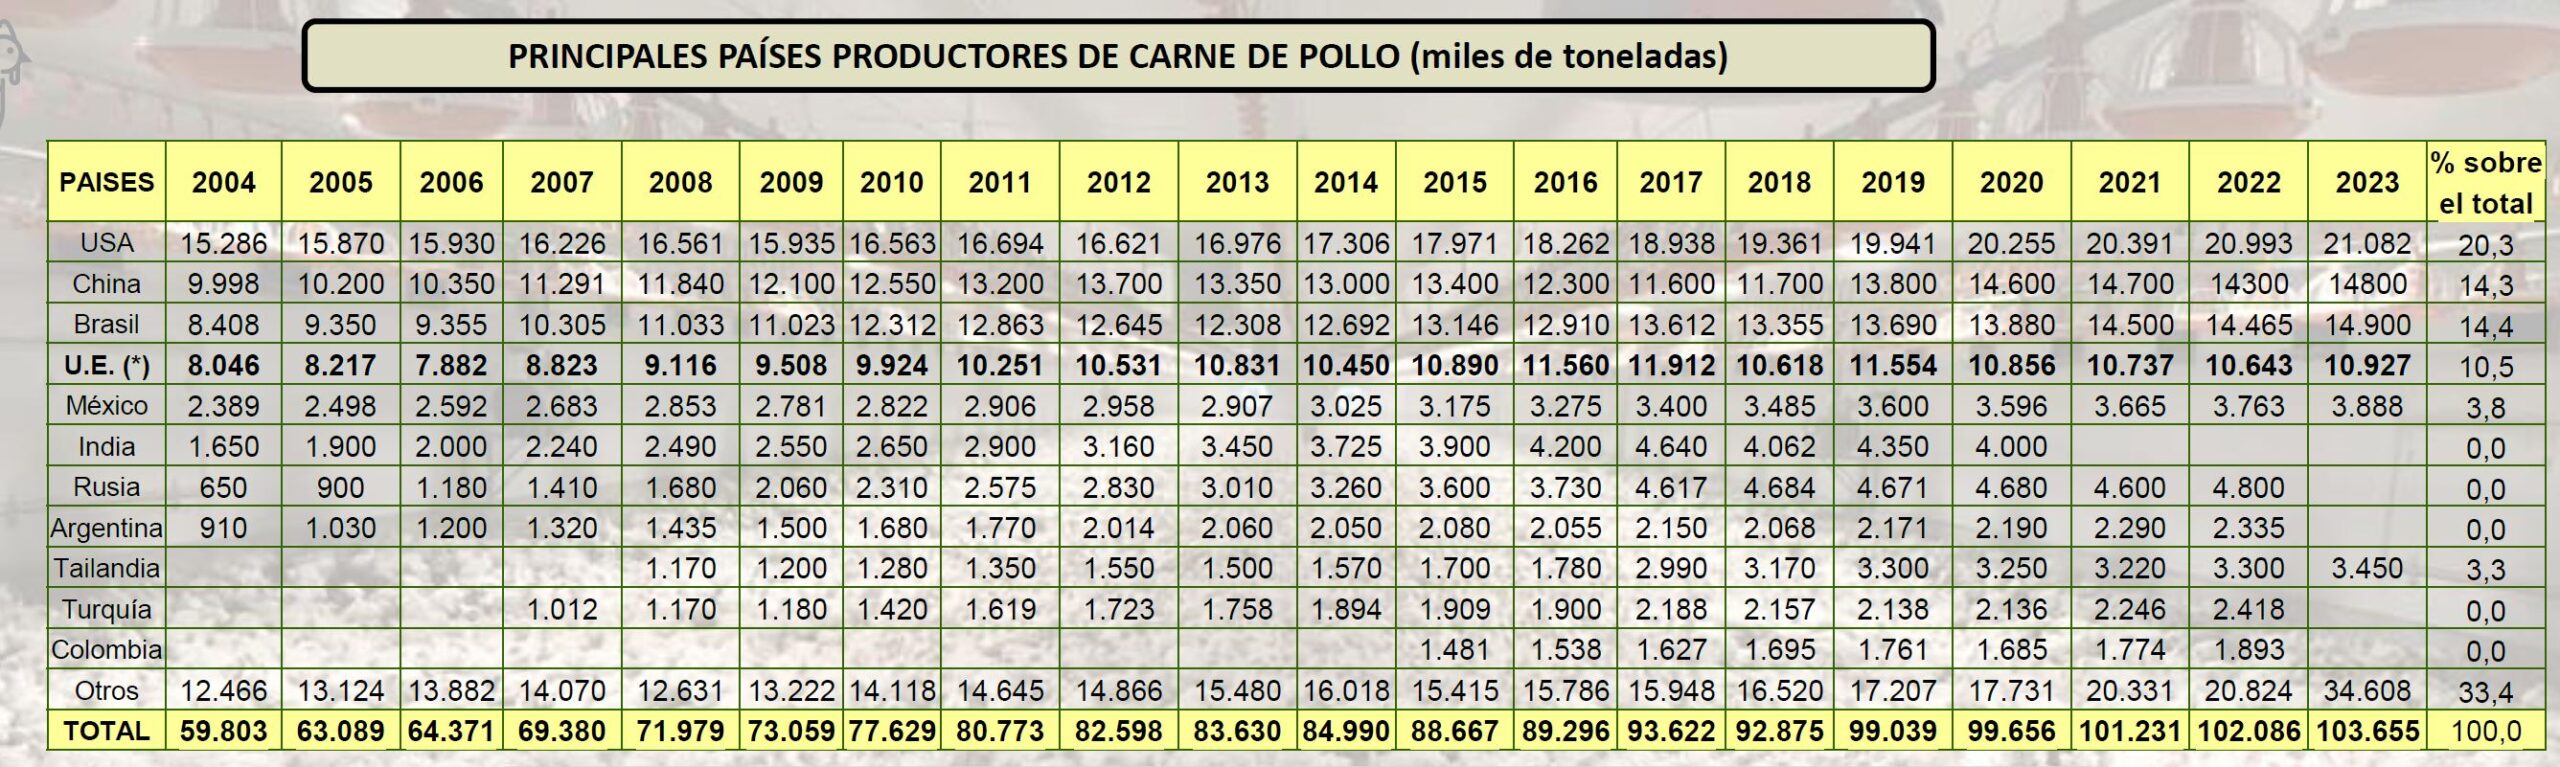
The EU in relation to the rest of the world
The following table shows the significance of the EU relative to the other major poultry meat producing regions worldwide.
| Geographic areas | 2010 | 2015 | 2020 | 2023 | % of total |
|---|---|---|---|---|---|
| United States | 16,563 | 17,971 | 20,255 | 21,082 | 20.3 |
| China | 12,550 | 13,400 | 14,500 | 14,300 | 14.3 |
| Brazil | 12,312 | 13,146 | 13,880 | 124,900 | 14.4 |
| EU | 9,923 | 10,890 | 10,856 | 10,927 | 10.5 |
| Mexico | 2,822 | 3,176 | 3,596 | 3,888 | 3.5 |
| India | 2,650 | 3,900 | 4,000 | ¿ | – |
| Russia | 2,316 | 3,600 | 4,680 | ¿ | – |
| Argentina | 1,660 | 2,080 | 2,190 | ¿ | – |
| Thailand | 1,280 | 1,700 | 3,250 | 3,400 | 3.3 |
| Turkey | 1,420 | 1,909 | 2,136 | ¿ | – |
| Colombia | – | 1,481 | 1,685 | ¿ | – |
| Others | 14,118 | 15,415 | 17,731 | 34,608 | 33.4 |
| Total | 77,628 | 88,667 | 99,656 | 103,656 | 100.0 |
As can be seen, the EU’s share of global production has been increasing, albeit not as rapidly in proportional terms as that of other notable regions.
Foreign trade
The spectacular evolution of foreign trade in poultry meat is illustrated in these two charts.
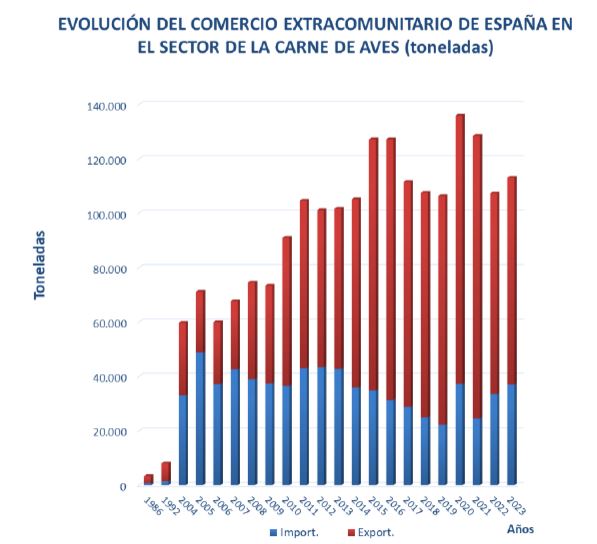
The changes that have occurred over these almost 30 years require no further comment beyond highlighting the significance of the effort made by the broiler and turkey sectors in adopting the most advanced production techniques to bring these key protein sources within reach of the population.
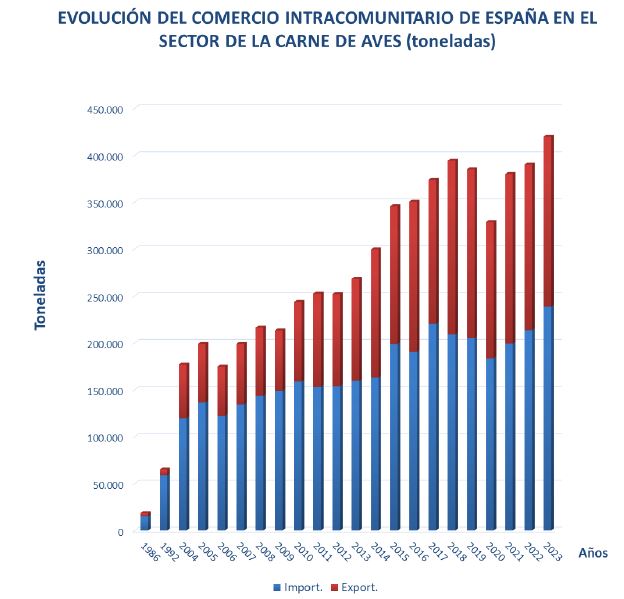
The changes that have occurred over these almost 30 years require no further comment beyond highlighting the significance of the effort made by the broiler and turkey sectors in adopting the most advanced production techniques to bring these key protein sources within reach of the population.
Poultry meat consumption
The evolution of Spain’s degree of dependence on imports for poultry meat is shown in the attached chart, together with the so-called annual per capita “apparent consumption”.
Production and Consumption Table 1992–2023
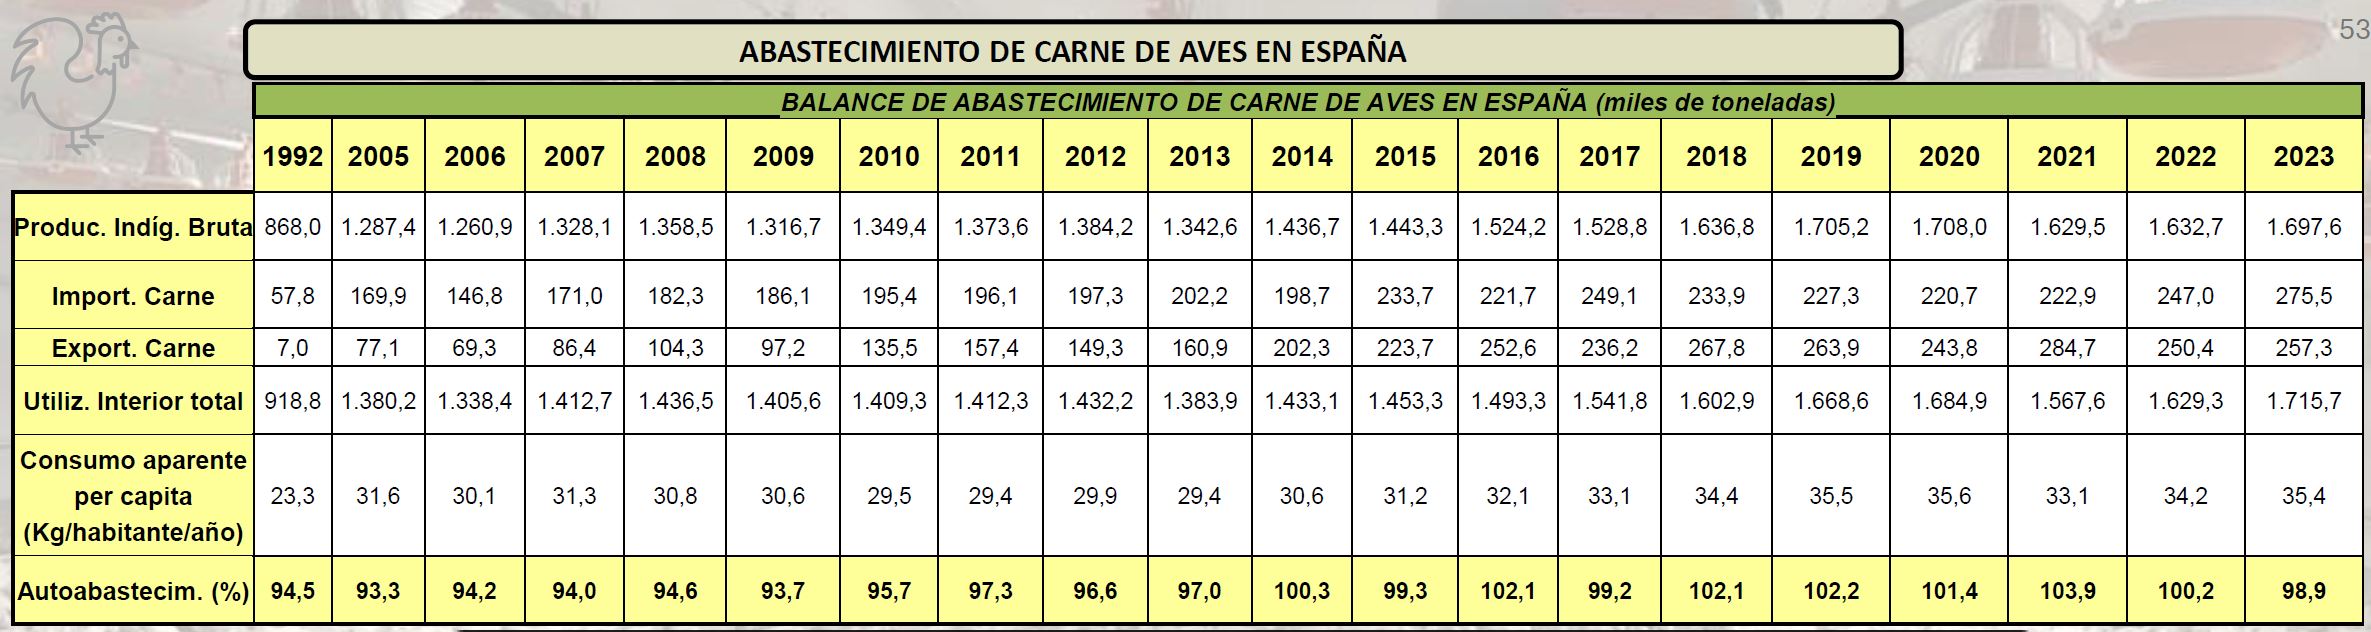
Chart of apparent consumption and self-sufficiency rate 1986–2023
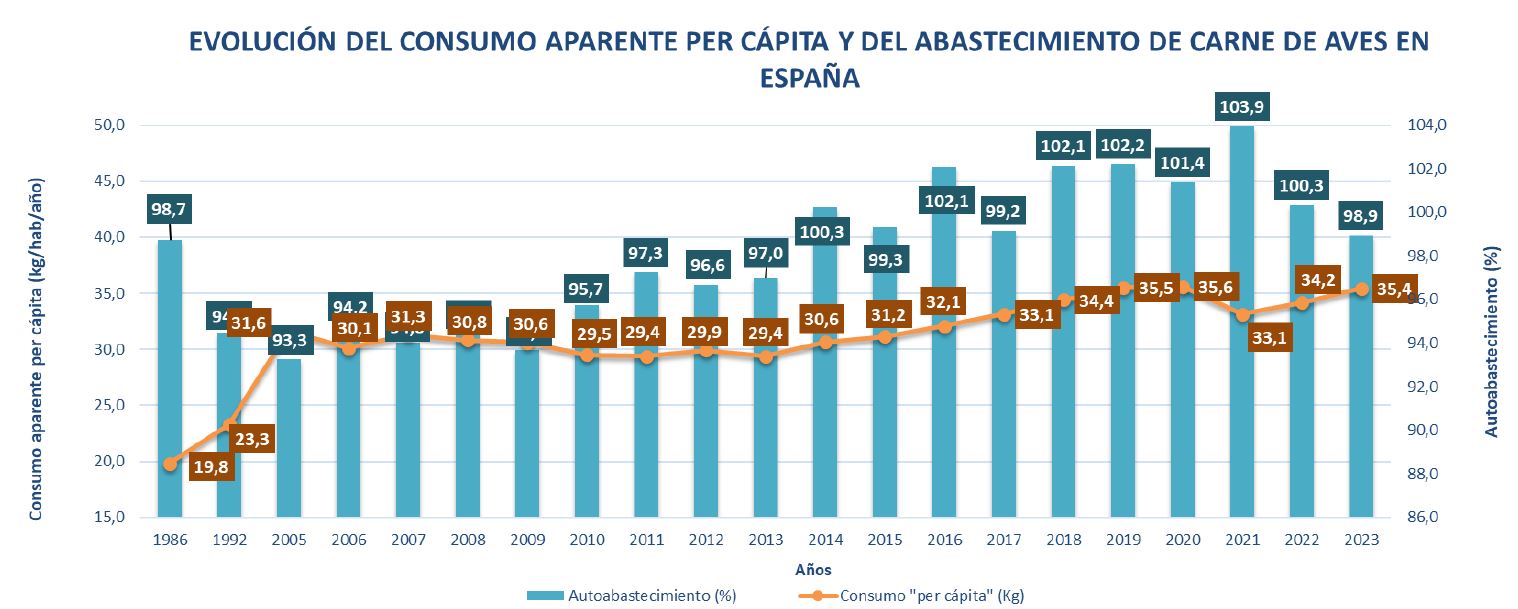
Our final observation on this point, regarding poultry meat consumption (broiler and other poultry combined), is to express regret that MAPA has not supplemented the information presented elsewhere in this document on household chicken consumption (which appears to be declining!) with data on out-of-home consumption — which should obviously have increased, and considerably, if we are to explain this apparent paradox!
Federico Castelló
Director of NeXusAvicultura.com
For further information:
-. Official MAPA Report (67 pages): “The broiler sector in figures”. Key economic indicators 2023. Report published in August 2024